Unlimited Transcriptions
for Audio and Video
Accurate transcripts in seconds, with uncompromising privacy.
no credit card requiredTrusted byleading organizationsworldwide
From research universities to global media enterprises


Powering transcript workflows for 100,000+ professionals worldwide
Features
Transcriptions Made Easy
State-of-the-art AI
Powered by OpenAI's Whisper for industry-leading accuracy. Support for custom vocabularies, up to 10 hours long files, and ultra fast results.

Import from multiple sources
Import audio and video files from various sources including direct upload, Google Drive, Dropbox, URLs, Zoom, and more.
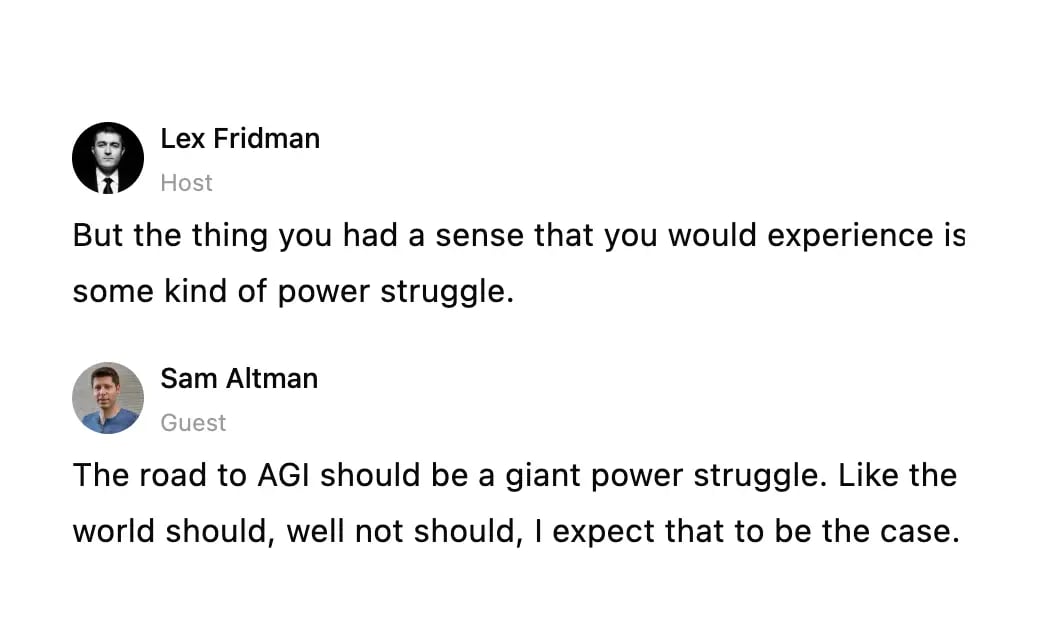
Speaker detection
Automatically identify different speakers in your recordings and label them with their names.
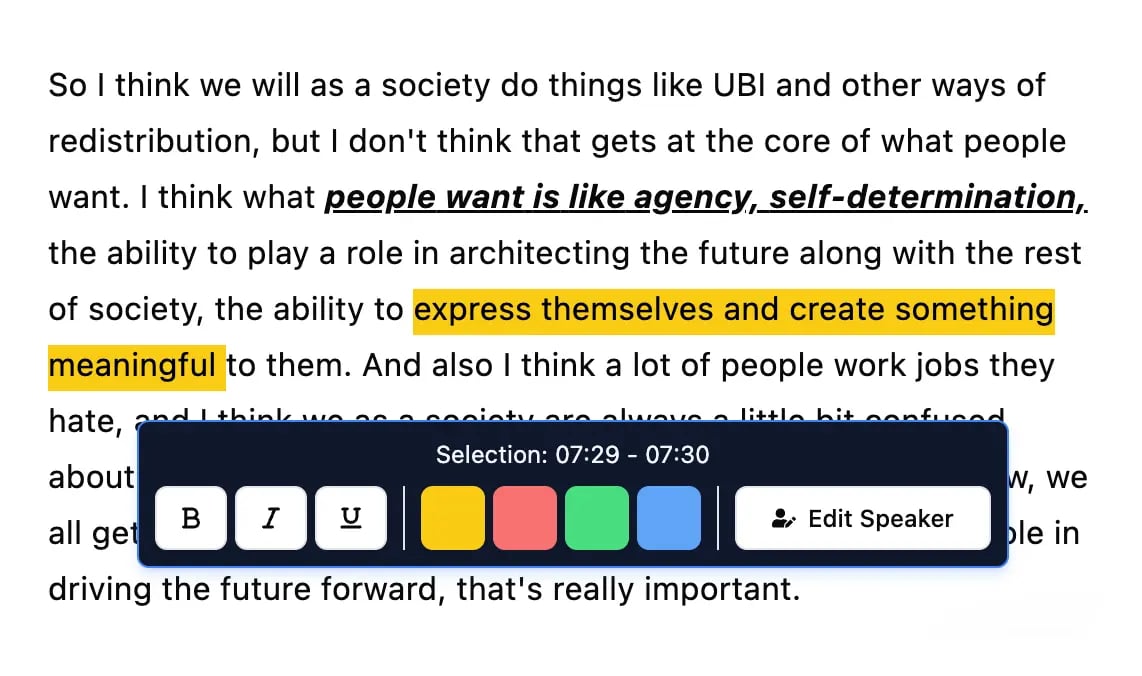
Editing tools
Edit transcripts with powerful tools including find & replace, speaker assignment, rich text formats, and highlighting.
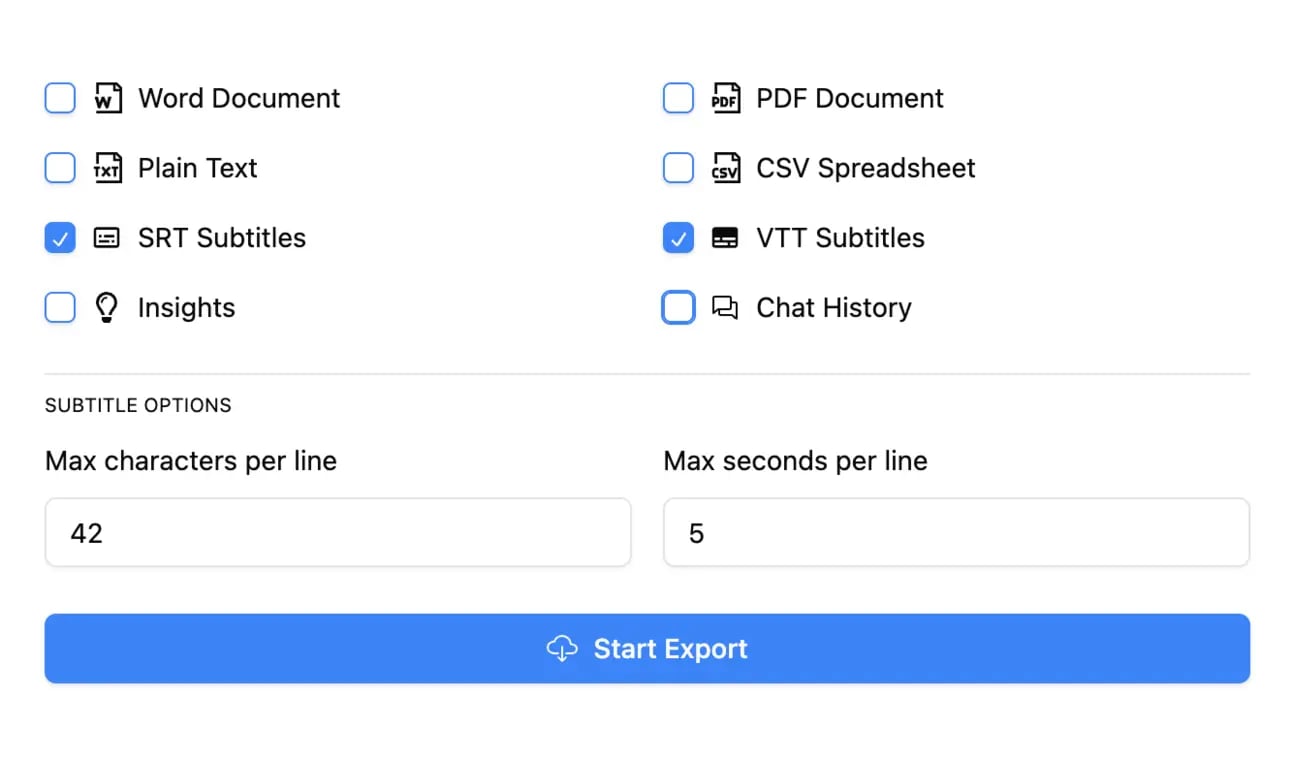
Export in multiple formats
Export your transcripts in multiple formats including TXT, DOCX, PDF, SRT, and VTT with customizable formatting options.
Summaries and Chatbot
Generate summaries & other insights from your transcript, reusable custom prompts and chatbot for your content.
Integrations
Connect with your favorite tools and platforms to streamline your transcription workflow.
Shared spaces
Shared access for your whole team or select members
Folders
Folders and subfolders to organise large content catalogues
Search
Find exactly what you are looking for with search across all your content
Rated 4.8 based on 1,246 reviews
What people say
Stefania Laventure
I'm really enjoying Transcript LOL. It has evolved so much since I bought it. I love the AI feature to analyze your transcript (customer insights, customer pains, for example). Super useful for customer interviews and sales calls.
I also use the new feature to transcribe the WhatsApp audio that I receive. Very helpful for me.
Stack Bounty
Looking for free and accurate transcripts for your videos, podcasts, or meetings? Transcript.LOL is just the solution you've been seeking. With its AI-driven technology, this tool swiftly converts audio recordings into written text, offering seamless transcription services that cater to content creators, marketers, podcasters, and more.
Cosmic 365 AI
Need quick and accurate transcriptions? Look no further than Transcript.LOL, it's an easy to use tool that turns your audio and video files into text in no time! 🚀✨
Tiffany Johnson
I was hesitant to try another transcription service since I've been disappointed in the past, but Transcript.LOL has exceeded my expectations!
The transcription quality is impressive - it handles various accents and speech patterns really well. I've been using it for podcast episodes and client interviews, and the accuracy has been consistently high.
What I love most is how fast it processes files. I can upload a 2-hour recording and get the transcript back in just a few minutes. The time-stamped format makes it easy to navigate and find specific sections.
The AI summary feature is also a game-changer - it pulls out the key points so I don't have to read through everything. Definitely worth the investment!
Loudegg
...If you're on the hunt for a powerful transcription tool that not only transcribes your audio or video files but also elevates your content creation process, look no further than Transcript.lol. This tool is a true game-changer, offering a seamless experience for anyone looking to optimize their content strategy.
What sets Transcript.lol apart is its multifaceted transcription options. Beyond just transcribing, you can generate summaries, topics, chapters, blog posts, newsletters, and even social media content for platforms like LinkedIn and Twitter. This feature is a huge time-saver, allowing you to focus on what truly matters—creating engaging content.
Ricardo Arroyo
Great Tool for Copywriters – Worth Every Penny! I've recently started using this app, and I'm having an absolute blast with it!
I use it primarily to extract text that I can reference for my copywriting projects, and it saves me so much time. No more pausing and rewinding to jot down notes – it does all the heavy lifting for me.
The accuracy of the transcriptions is impressive, and the summaries help me get to the key points quickly.
What's even better is that this app is worth far more than what I paid for it. The value it provides is incredible, and it's made my job so much easier and more efficient.
Crowded Lab
...I found the transcription functionality to be exceptionally accurate.
One of the standout features is its ability to generate quizzes for educational content and newsletters, making it versatile for different needs.
Samples
Popular Creators
Checkout unedited content from popular creators as processed by Transcript LOL


Pricing
Cutting-Edge Tech At Affordable Price
Free
Get started with basic transcription
Unlimited
Unlimited usage for individuals
billed $120 annuallySAVE 50%
Team
Collaboration features for teams
billed $240 annuallySAVE 50%
Is Transcript LOL really unlimited?
Yes! Transcript LOL really is unlimited for non-automated usage!
There are no caps on overall usage and customers regularly transcribe hundreds of hours per month. The only rule is you can't share your login/account with others.
Which audio / video formats do you support?
Transcript LOL supports the vast majority of common audio and video formats, including MP3, M4A, MP4, MOV, AAC, WAV, OGG, OPUS, MPEG, WMA, WMV, AVI, FLAC, AIFF, ALAC, 3GP, MKV, WEBM, VOB, RMVB, MTS, TS, QuickTime, and DivX.
Will my content appear in AI models?
No, never!
Your content is secure and private. We never use your data to train AI models.
We have agreements with all our sub-processors that prohibit them from using your data for any purpose. We have a strict no-training policy.