Wie man Interviewdaten analysiert: Ein praktischer Leitfaden
Erfahren Sie, wie Sie Interviewdaten mit unserem praktischen Leitfaden analysieren. Wir behandeln Transkription, Kodierung und die Verwendung von KI-Tools, um umsetzbare Erkenntnisse aus Ihrer Forschung zu gewinnen.
Praveen
June 5, 2024
Okay, lass uns aufschlüsseln, wie man Interviewdaten tatsächlich analysiert. Es geht nicht nur darum, deine Notizen durchzulesen. Die wahre Magie geschieht, wenn du von einem Haufen roher Kommentare zu einer klaren Geschichte gelangst, die deine Forschungsfragen beantwortet.
Es ist ein Prozess des Transkribierens des Audios, des systematischen Kodierens des Textes, um Schlüsselkonzepte herauszuziehen, und dann des Gruppierens dieser Codes in breitere, aussagekräftigere Themen.
Die Bühne für effektive Analyse bereiten

Bevor du auch nur daran denkst, eine einzige Textzeile zu kodieren, musst du deine Hausaufgaben machen. Ich habe so viele Projekte scheitern sehen, weil diese grundlegende Arbeit überstürzt wurde.
Die richtige Einrichtung dient nicht nur der Organisation; sie schafft einen klaren, ethischen und effizienten Weg, um echte Erkenntnisse zu gewinnen. Ein guter Ausgangspunkt ist, die Grundlagen zu verstehen, indem man Methoden der qualitativen Datenanalyse versteht.
Transkription und Anonymisierung
Zuerst: Transkription. Das ist deine erste große Entscheidung. Benötigst du ein wortwörtliches Transkript, das jedes einzelne "Ähm", "Äh" und jede peinliche Pause erfasst? Oder ist ein intelligentes Transkript, das Füllwörter für bessere Lesbarkeit bereinigt, der richtige Weg?
Für die meisten Geschäfts- oder UX-Forschung ist ein intelligentes Transkript völlig ausreichend und viel einfacher zu handhaben.
Dies ist auch der Zeitpunkt, um die Anonymisierung zu handhaben. Überspringe das nicht. Ich habe einmal vergessen, einen spezifischen Projektnamen zu schwärzen, der in einem frühen Interview erwähnt wurde, was bedeutete, dass ich später mühsam jede einzelne Datei durchgehen musste, um die Vertraulichkeit zu gewährleisten. Glaub mir, diesen Fehler willst du nicht machen.
Wichtige Erkenntnis: Ersetze systematisch alle Namen, Unternehmensnennungen und andere identifizierende Details von Anfang an durch konsistente Codes (wie
[Teilnehmer 1],[Unternehmen X]).
Interviewanalyse für Sie erledigt

Sprechererkennung
Identifiziere automatisch verschiedene Sprecher in deinen Aufnahmen und beschrifte sie mit ihren Namen.
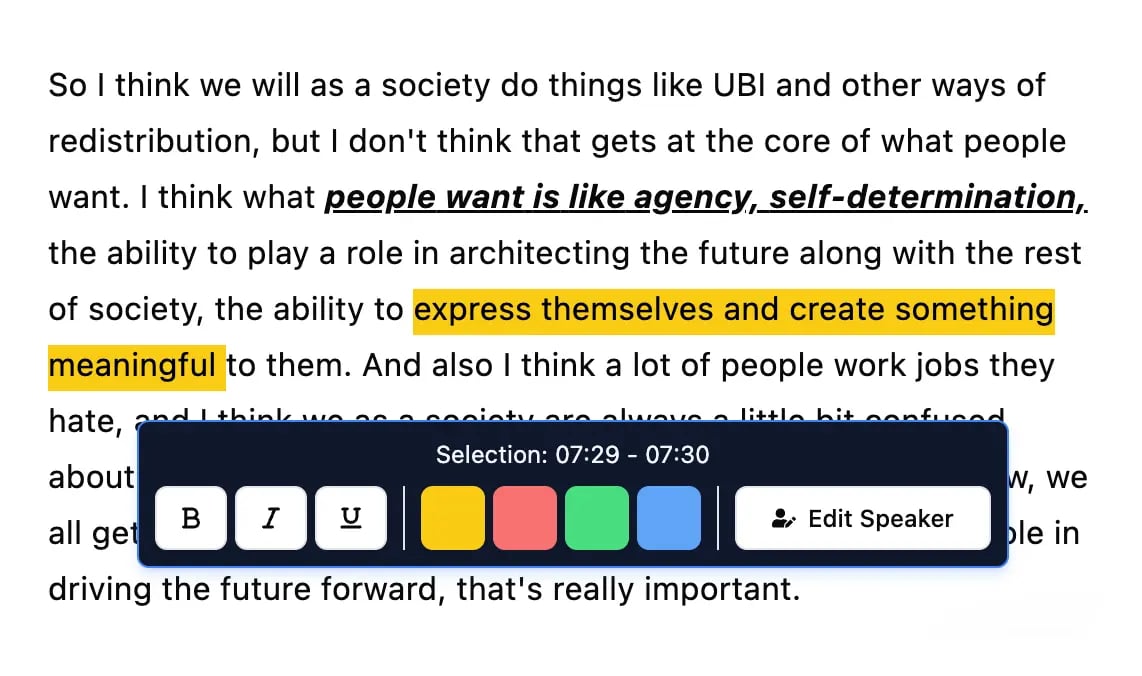
Bearbeitungswerkzeuge
Bearbeite Transkripte mit leistungsstarken Werkzeugen wie Suchen und Ersetzen, Sprecherzuordnung, Rich-Text-Formate und Hervorhebungen.
Zusammenfassungen und Chatbot
Erstelle Zusammenfassungen und andere Erkenntnisse aus deinem Transkript, wiederverwendbare benutzerdefinierte Prompts und Chatbot für deine Inhalte.
Aufbau Ihres Analyse-Frameworks
Eine saubere Dateistruktur wird Ihr bester Freund sein. Ernsthaft. Erstellen Sie separate Ordner für Ihre Roh-Audiodateien, Ihre fertigen Transkripte und Ihre Analyse-Notizen. Diese einfache Gewohnheit verhindert totales Chaos, wenn Ihre Daten sich stapeln.
Ebenso wichtig ist die Schärfung Ihrer Forschungsfragen. Diese Fragen sind Ihr Nordstern und leiten alles, wonach Sie in den Daten suchen. Wenn Ihre Fragen vage sind, wird Ihre Analyse es auch sein.
- Vage: Was denken die Nutzer über unsere App?
- Scharf: Mit welchen spezifischen Usability-Herausforderungen sehen sich neue Nutzer während des Onboarding-Prozesses in unserer mobilen App konfrontiert?
Sehen Sie den Unterschied? Dieses Maß an Spezifität hilft Ihnen, Ihr Coding zu fokussieren und stellt sicher, dass Ihre Ergebnisse tatsächlich nützlich sind. Die Qualität Ihrer Interviewfragen bestimmt direkt die Qualität Ihrer Daten.
Deshalb wird erwartet, dass bis 2025 schätzungsweise 75 % der Unternehmen in wichtigen Märkten strukturierte Interviewformate verwenden werden. Es geht darum, Datenkonsistenz zu gewährleisten und Voreingenommenheit zu reduzieren. Diese Struktur ist absolut entscheidend für jeden, der lernt, wie man Interviewdaten effektiv analysiert.
Bedeutung in Roh-Transkripten finden
Okay, Ihre Transkripte sind bereit. Jetzt kommt der unterhaltsame Teil: hineingraben, um zu entdecken, was das alles bedeutet. Hier können Sie die Ärmel hochkrempeln und wirklich beginnen, die Geschichten aufzudecken, die sich offen zeigen.
Für einen Moment vergessen wir die dichten akademischen Theorien. In dieser Phase geht es darum, sich in die Daten einzutauchen und die Erkenntnisse einfach an die Oberfläche sprudeln zu lassen.
Die erste große Aufgabe ist das, was Forscher offenes Coding nennen. Betrachten Sie es als einen ersten Scan, bei dem Sie jedes Transkript durchlesen und kurze, beschreibende Etiketten – oder „Codes“ – auf verschiedene Textabschnitte kleben. Diese Codes sollen die Kernkonzepte, Gefühle oder Prozesse erfassen, die Ihr Interviewpartner erwähnt hat. Der Schlüssel ist, den Daten treu zu bleiben und sie nicht in bereits erstellte Schubladen zu zwängen.
Die Kunst des offenen Codings
Nehmen wir an, Sie recherchieren Benutzerinterviews für eine neue E-Commerce-App. Ein Teilnehmer sagt Ihnen: „Ich habe ewig gebraucht, um herauszufinden, wie ich bezahlen kann. Der Checkout-Button war einfach nicht da, wo ich ihn erwartet habe.“
Es ist verlockend, zu einer breiten Schlussfolgerung wie „die App ist schlecht“ zu springen, aber das ist nicht hilfreich. Stattdessen möchten Sie spezifische, datengestützte Codes erstellen. Ihr Prozess könnte ungefähr so aussehen:
- „Ich habe ewig gebraucht...“ könnte den Code
Zeitaufwand für Aufgabeerhalten. - „...um herauszufinden, wie ich bezahlen kann.“ könnte zu
Verwirrung im Zahlungsprozesswerden. - „Der Checkout-Button war nicht da, wo ich ihn erwartet habe...“ könnte als
Unerwartetes UI-Layoutgekennzeichnet werden.
Diese kleinen beschreibenden Codes sind Ihre Bausteine. Mein Rat? Seien Sie in dieser Phase detaillierter, als Sie denken, dass Sie es sein müssen. Sie können Codes später immer noch zusammenführen, aber Sie können einen vagen Code nachträglich nicht einfach in spezifische aufteilen.
Diese Art der granularen Interpretation ist eine gefragte Fähigkeit. Tatsächlich hat sich die Häufigkeit strukturierter statistischer Fragen in Interviews im Technologiesektor in den letzten fünf Jahren verdoppelt. Dies zeigt einen klaren Trend: Unternehmen suchen Menschen, die Experten für Dateninterpretation sind.
Mein persönlicher Tipp: Obsessieren Sie sich nicht damit, die Codes beim ersten Versuch perfekt hinzubekommen. Der erste Durchgang dient der Erkundung. Ich empfehle immer, ein Transkript einmal durchzulesen, nur um die allgemeine Stimmung zu erfassen, und dann noch einmal zurückzugehen, um tatsächlich mit dem Anwenden von Codes zu beginnen. Das verhindert, dass Sie sich zu früh in den Details verlieren.
KI als Ihr Coding-Assistent
Traditionell ist diese anfängliche Coding-Phase ein massiver Zeitfresser. Sie ist anstrengend, erfordert intensive Konzentration und kann für ein einzelnes Interview leicht Stunden dauern. Genau hier können moderne Tools Ihnen einen enormen Vorteil verschaffen.
KI-gestützte Plattformen können Ihnen einen Vorsprung verschaffen, indem sie automatisch erste Codes und Themen direkt aus dem Transkript vorschlagen. Sie können wiederkehrende Schlüsselwörter und Konzepte in Sekundenschnelle erkennen und Ihnen eine vorläufige Liste von Labels präsentieren, mit denen Sie beginnen können.
Zum Beispiel könnte ein KI-Tool automatisch jede Erwähnung von „Preis“, „Kosten“ und „Abonnement“ hervorheben und dann einen Code wie Preisbedenken vorschlagen. Es geht nicht darum, Ihr Urteilsvermögen zu ersetzen, sondern darum, es zu beschleunigen. Sie haben immer das letzte Wort. Sie können die Vorschläge der KI akzeptieren, ablehnen oder anpassen und so sicherstellen, dass die Analyse immer noch auf Ihrer eigenen Expertise basiert.
Dies ist ein Game-Changer, wenn Sie mit einer großen Menge an Transkripten aus Einzelgesprächen und Fokusgruppen umgehen. Mehr über die Verwaltung dieses Workflows erfahren Sie in unserem Leitfaden zur Transkription von Interviews und Fokusgruppen.
Von anfänglichen Codes zu übergeordneten Themen
Okay, Sie haben die harte Arbeit geleistet, Ihre anfänglichen Codes zu erstellen. Ihre Daten fühlen sich langsam weniger wie eine Textwand an und mehr wie etwas Handhabbares. Aber im Moment sind diese Codes nur einzelne Wegweiser. Die wahre Magie geschieht, wenn Sie sehen, wie sie sich verbinden, um die Hauptverkehrsadern der Bedeutung in Ihrer Forschung zu bilden.
Dieser Teil des Prozesses dreht sich darum, von diesen kleinen, granularen Labels zu der übergeordneten Geschichte zu gelangen, die Ihre Interviews erzählen wollen.
Stellen Sie es sich so vor: Sie haben gerade eine Bestandsaufnahme in einer unordentlichen Garage gemacht. Sie haben Haufen von Schraubendrehern, Hämmern und Schraubenschlüsseln. Sie würden sie nicht einfach verstreut liegen lassen. Sie würden beginnen, sie in logische Eimer zu gruppieren: „Handwerkzeuge“, „Elektrowerkzeuge“, „Befestigungselemente“. In der Datenanalyse nennen wir diesen Gruppierungsprozess axiales Coding.
Codes zu Kategorien zusammenfassen
Hier beginnen Sie, die passende Funktion für Ihre Codes zu spielen. Das Ziel ist es, Beziehungen zu erkennen und ähnliche Codes zu breiteren, aufschlussreicheren Kategorien zusammenzufassen. Sie beginnen zu synthetisieren, endlich den Wald vor lauter Bäumen zu sehen.
Bleiben wir bei unserem Benutzerforschungsbeispiel für eine neue E-Commerce-App. Ihr erster Coding-Durchgang hat Ihnen möglicherweise eine Liste von Dutzenden von Codes geliefert, die ungefähr so aussehen:
Verwirrung im ZahlungsprozessUnerwartetes UI-LayoutLangsame BildladungSchwer zu findender Checkout-ButtonFrustration mit der Navigation
Wenn Sie diese Liste betrachten, werden Muster sichtbar. Verwirrung im Zahlungsprozess, Unerwartetes UI-Layout und Schwer zu findender Checkout-Button deuten alle darauf hin, wie einfach (oder nicht) ein Benutzer Dinge erledigen kann. Boom. Sie können diese unter einer neuen, leistungsfähigeren Kategorie zusammenfassen: Usability-Hürden.
Ebenso finden andere Codes auf natürliche Weise ihren Platz in Kategorien wie Performance-Probleme oder Negative emotionale Reaktionen.
Pro-Tipp: Haben Sie keine Angst, hier unordentlich zu werden. Ich bin ein großer Fan davon, virtuelle Haftnotizen auf einem Tool wie Miro oder sogar nur ein physisches Whiteboard zu verwenden. Das visuelle Ziehen und Ablegen von Codes in verschiedenen Gruppen kann Verbindungen hervorrufen, die Sie völlig übersehen würden, wenn Sie nur auf eine Tabelle starren würden.
Identifizierung der Kernthemen
Wenn Kategorien Ihren Daten Struktur verleihen, geben Themen ihnen eine Seele. Ein Thema ist die zentrale Erzählung, die die große „So what?“-Frage beantwortet. Es ist nicht nur ein Eimer; es ist eine interpretative Aussage, die zum Kern dessen vordringt, was Ihre Teilnehmer erlebt haben.
Sie wissen, dass Sie ein starkes Thema gefunden haben, wenn mehrere Ihrer Kategorien auf dasselbe zugrunde liegende Problem hinzuweisen scheinen. Zum Beispiel könnten Ihre Kategorien Usability-Hürden, Performance-Probleme und Negative emotionale Reaktionen alle in einem einzigen, mächtigen, übergeordneten Thema gipfeln: Benutzervertrauen, das durch schlechte Erfahrung untergraben wird.
Jetzt das erzählt eine Geschichte. Es ist eine klare, umsetzbare Erkenntnis, die ein Stakeholder tatsächlich verstehen und darauf reagieren kann, was weitaus wirkungsvoller ist, als nur die einzelnen Codes aufzulisten.
Dieses Bild hilft wirklich zu visualisieren, wie all diese Teile zusammenpassen.
Wie Sie sehen können, führen viele scheinbar getrennte Probleme oft zu nur wenigen kritischen Erkenntnissen. Das sind die, die die meiste Aufmerksamkeit verdienen.
Dieser systematische Ansatz ist entscheidend, egal ob Sie ein akademischer Forscher oder ein Journalist sind, der versucht, eine komplexe Geschichte zusammenzufügen. Die Kernprinzipien sind dieselben: Muster finden, die Erzählung aufbauen. Für einen tieferen Einblick werfen Sie einen Blick auf unsere Ressourcen, wie KI bei Journalisten- und Medieninterviews hilft, wo die Strukturierung von Informationen auf diese Weise absolut entscheidend ist. Dieser Prozess verwandelt einen Berg von Zitaten in einen kohärenten und aussagekräftigen Bericht.
Ihre Ergebnisse in eine überzeugende Geschichte übersetzen

Sie haben also die harte Arbeit geleistet. Ihre Interviews sind codiert, Ihre Themen sind identifiziert und Ihre Tabelle ist ein Meisterwerk der qualitativen Analyse. Aber hier ist die Sache: Es ist noch nicht fertig. Tatsächlich beginnt der wichtigste Teil gerade erst.
Eine Tabelle voller Roh-Erkenntnisse ist nur für Sie nützlich. Um die Zustimmung von Stakeholdern zu erhalten, Ihren Chef zu überzeugen oder die Richtung Ihres Produkts zu ändern, müssen Sie diese Daten in eine Geschichte verwandeln. Hier werden Sie vom Forscher zum Influencer.
Zu lernen, wie man Interviewdaten analysiert, ist eine Sache; sie zu kommunizieren zu lernen, ist alles.
Eine klare Erzählung gestalten
Jede gute Geschichte hat einen Anfang, eine Mitte und ein Ende. Ihre Analyse ist nicht anders. Beginnen Sie damit, die wichtigste, verblüffendste oder bahnbrechendste Erkenntnis zu identifizieren, die Sie aufgedeckt haben. Das ist Ihre Schlagzeile. Führen Sie damit.
Führen Sie Ihr Publikum nicht chronologisch durch Ihren Forschungsprozess. Strukturieren Sie stattdessen Ihre Präsentation oder Ihren Bericht um Ihre Schlüsselthemen herum und behandeln Sie jedes wie ein Kapitel in Ihrer Geschichte.
Folgen Sie für jedes Thema einem einfachen, aber wirkungsvollen Fluss: machen Sie Ihre Behauptung, untermauern Sie sie mit Beweisen (diese saftigen Zitate und Datenpunkte) und erklären Sie dann die Auswirkungen. Warum ist das wichtig? Was sollen wir dagegen tun? Diese Struktur verwandelt einen Daten-Dump in ein überzeugendes Argument, hinter dem jeder stehen kann.
Schlüssel-Erkenntnis: Ein klassischer Anfängerfehler ist es, Ergebnisse in der Reihenfolge zu präsentieren, in der Sie sie entdeckt haben. Drehen Sie das Skript um. Organisieren Sie Ihre Themen nach Wichtigkeit. Beginnen Sie mit der kritischsten oder überraschendsten Erkenntnis, um die Aufmerksamkeit Ihres Publikums von Anfang an zu fesseln.
Ihre qualitativen Daten visualisieren
Seien wir ehrlich, niemand liebt eine Textwand. Visualisierungen sind Ihre Geheimwaffe, um komplexe Informationen verdaulich und, was noch wichtiger ist, einprägsam zu machen.
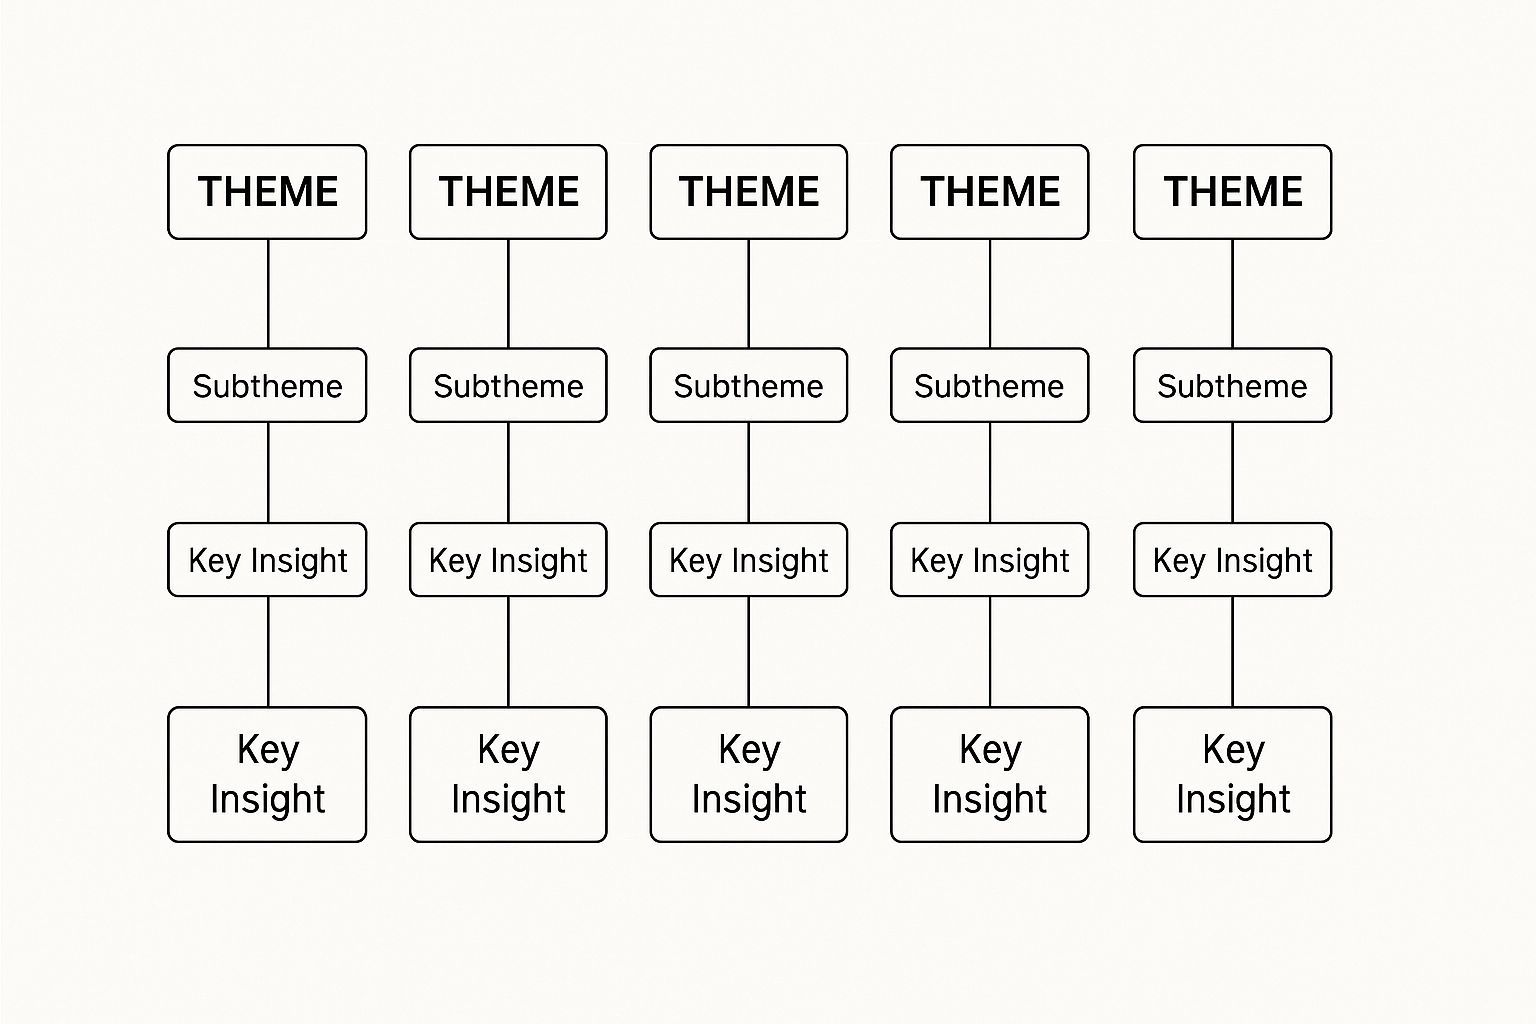
Sicher, Sie können Balkendiagramme verwenden, aber qualitative Daten erfordern oft etwas Nuancierteres. Eine Themenkarte zum Beispiel ist brillant, um zu zeigen, wie einzelne Codes zu breiteren Kategorien und Themen zusammenlaufen. Sie bietet eine Vogelperspektive Ihrer gesamten analytischen Struktur.
Wenn Sie Stakeholdern zeigen möchten, wie Sie von Chaos zu Klarheit gelangt sind, ist ein Affinitätsdiagramm perfekt. Es demonstriert visuell den Prozess des Gruppierens von Dutzenden einzelner Kommentare in logische, aussagekräftige Gruppen. Es schafft Vertrauen, indem es Ihren Prozess transparent macht.
Die Wahl der richtigen Visualisierung hängt vollständig davon ab, welchen Teil der Geschichte Sie erzählen möchten.
Datenvisualisierungsmethoden für die Interviewanalyse
Hier ist eine kurze Übersicht über einige Methoden, zu denen ich immer wieder zurückkehre, und wofür sie am besten geeignet sind.
| Visualisierungsmethode | Am besten geeignet für | Hauptvorteil |
|---|---|---|
| Themenkarte | Zeigt die Beziehungen zwischen Themen und Unterthemen. | Veranschaulicht die Struktur und Hierarchie Ihrer Analyse. |
| Affinitätsdiagramm | Zeigt, wie einzelne Datenpunkte Cluster bilden. | Macht den Kategorisierungsprozess transparent und logisch. |
| Zitat-Hervorhebungen | Hebt kraftvolle Stimmen von Teilnehmern hervor. | Fügt emotionale Gewichtung hinzu und humanisiert die Datenergebnisse. |
| Journey Map | Visualisiert den Prozess, die Schmerzpunkte und Emotionen eines Benutzers. | Stellt Ergebnisse in den Kontext eines realen Szenarios. |
Schließlich unterschätzen Sie niemals die Macht eines direkten Zitats. Das Herausgreifen einiger wirkungsvoller Zitate fügt eine Ebene roher, menschlicher Authentizität hinzu, die kein Diagramm nachbilden kann. Ein einzelner, gut gewählter Satz eines Teilnehmers kann oft ein Schlüsselthema wirkungsvoller zusammenfassen als ein ganzer Absatz Ihrer eigenen Schrift.
Das sind die Momente, die den Leuten lange nach dem Ende der Präsentation im Gedächtnis bleiben. Ihr Ziel ist es nicht nur, Daten zu präsentieren; es ist, sie unvergesslich zu machen.
KI zur Optimierung Ihres Analyse-Workflows nutzen
Manuelle Datenanalyse ist unglaublich aufschlussreich, aber seien wir ehrlich: Es ist eine Plackerei. Die Stunden, die für Transkription, Lesen und erneutes Lesen von Transkripten aufgewendet werden, können immens sein, besonders wenn Sie unter Zeitdruck stehen. Hier können KI-Tools ein mächtiger Verbündeter werden, nicht um Ihr kritisches Denken zu ersetzen, sondern um es zu verstärken.
Der offensichtlichste Gewinn ist die Automatisierung der Transkription. Ein KI-Tool kann Stunden an Audio in wenigen Minuten in ein genaues Textdokument umwandeln. Damit haben Sie einen riesigen Zeitblock freigeschaufelt, der viel besser für die eigentliche Interpretation genutzt werden kann.
Jenseits der Transkription: Ein analytischer Vorsprung
Aber die wahre Magie moderner KI-Tools geschieht nachdem das Transkript fertig ist. Anstatt auf eine Textwand und eine leere Leinwand zu starren, erhalten Sie einen sofortigen Überblick über Ihre Daten.
Stellen Sie sich vor, Sie laden ein Interview hoch und erhalten fast sofort eine Zusammenfassung mit vorgeschlagenen Schlüsselthemen und Sentiment-Analysen. Das ist ein enormer Vorsprung.
Zum Beispiel könnte eine KI sofort jede Erwähnung von „Kundensupport“ hervorheben und automatisch die Stimmung kennzeichnen – positiv, negativ oder neutral. Das hilft Ihnen, Muster viel schneller zu erkennen, als Sie es jemals durch manuelles Durchlesen könnten.
- Vorschläge für anfängliche Themen: KI kann wiederkehrende Konzepte erkennen und erste Codes vorschlagen, was Ihnen hilft, den zeitaufwändigsten Teil des offenen Codings zu umgehen.
- Sentiment-Analyse: Messen Sie sofort den emotionalen Ton hinter den Zitaten der Teilnehmer, um wirklich zu verstehen, wie sie sich fühlen.
- Automatische Sortierung: Filtern und gruppieren Sie Antworten schnell nach von Ihnen festgelegten Kriterien, wie z. B. Erwähnungen einer bestimmten Funktion oder eines Wettbewerbers.
KI in die Praxis umsetzen
Die Verwendung eines Tools wie Transcript.LOL ist ziemlich einfach. Sie laden einfach Ihre Audio- oder Videodatei hoch, und die Plattform beginnt mit der Transkription. Von dort aus können Sie die integrierten Funktionen nutzen, um Zusammenfassungen zu erstellen, Schlüsselthemen zu identifizieren und sogar eine Liste von Aktionspunkten zu erstellen.
Wenn Sie wirklich effizient werden wollen, hilft es, die Prinzipien der digitalen Prozessautomatisierung zu verstehen. Wenn Sie so denken, können Sie strukturieren, wie Sie diese Tools für die besten Ergebnisse integrieren.
Schlüssel-Erkenntnis: Das Ziel ist nicht, die KI für Sie denken zu lassen. Es geht darum, sie als unermüdlichen Forschungsassistenten einzusetzen. Die KI erledigt die schwere Arbeit und die anfängliche Aufschlüsselung, während Sie die menschliche Einsicht, Nuance und das kontextuelle Verständnis liefern, um die endgültige Geschichte zu gestalten.
Dieser Ansatz ermöglicht es Ihnen, Ihre Energie auf die strategische Arbeit auf hoher Ebene zu konzentrieren – die Verbindungen herzustellen und eine überzeugende Erzählung aufzubauen. Für eine detailliertere Anleitung können Sie unseren Leitfaden zur Nutzung von KI-Erkenntnissen erkunden, um das Beste aus Ihren Transkripten herauszuholen. Es geht darum, intelligenter und nicht härter zu arbeiten, um die mächtigen Geschichten aufzudecken, die in Ihren Daten verborgen sind.
Häufige Fragen zur Analyse von Interviewdaten
Selbst mit einem soliden Plan tauchen immer wieder einige Fragen auf, wenn Sie lernen, wie man Interviewdaten analysiert. Lassen Sie uns einige der häufigsten Hürden aus dem Weg räumen, damit Sie ohne Zweifel an Ihrer Arbeit vorankommen können.
Betrachten Sie dies als den Abschnitt „Dinge, die ich früher gewusst hätte“.
Wie viele Interviews sind für eine qualitative Analyse genug?
Ah, die klassische Frage „Wie lang ist ein Stück Schnur?“. Die Wahrheit ist, es gibt keine magische Zahl. Was Sie wirklich anstreben, ist thematische Sättigung.
Das ist der Punkt, an dem Sie aufhören, neue Dinge zu hören. Die Muster werden so klar, dass neue Interviews nur das bestätigen, was Sie bereits wissen.
In der akademischen Welt kann dies 12-20 Interviews dauern. Aber in der schnelllebigen Welt der UX-Forschung oder Produktentdeckung können Sie oft kraftvolle, umsetzbare Muster nach nur 5-8 fokussierten Gesprächen erkennen.
Mein Rat: Vergessen Sie die magische Zahl. Konzentrieren Sie sich auf den Reichtum der Daten. Machen Sie weiter, bis sich die Themen solide anfühlen und Sie ziemlich genau vorhersagen können, was die nächste Person zu einem Kernthema sagen wird. Das ist Ihr Signal zum Aufhören.
Was ist der Unterschied zwischen thematischer und Inhaltsanalyse?
Leute werfen diese Begriffe oft durcheinander, als wären sie dasselbe, aber sie dienen sehr unterschiedlichen Zwecken. Den Unterschied zu kennen, hilft Ihnen, das richtige Werkzeug für die jeweilige Aufgabe auszuwählen.
- Thematische Analyse dreht sich alles um Interpretation. Sie suchen nach den zugrunde liegenden Mustern der Bedeutung – den Themen –, die sich durch Ihre Daten ziehen. Es geht darum, in das Warum einzutauchen.
- Inhaltsanalyse dreht sich mehr um das Zählen. Sie konzentriert sich darauf, wie oft bestimmte Wörter, Phrasen oder Konzepte vorkommen. Diese Methode eignet sich hervorragend, um das Was und wie oft zu beantworten.
Wenn Sie also verstehen möchten, warum Ihre Kunden mit Ihrem Checkout-Prozess frustriert sind, ist das thematische Analyse. Wenn Sie nur zählen möchten, wie oft sie das Wort „langsam“ erwähnen, ist das Inhaltsanalyse.
Wie kann ich Voreingenommenheit in meiner Datenanalyse reduzieren?
Das ist ein großes Thema. Unsere eigenen Erfahrungen und Annahmen können leicht in unsere Interpretationen einschleichen, daher müssen wir bewusst darauf achten, sie im Zaum zu halten. Wenn Sie möchten, dass Ihre Ergebnisse glaubwürdig sind, können Sie dies nicht überspringen.
Eine einfache, aber wirkungsvolle Gewohnheit ist Reflexivität. Führen Sie ein Forschungsjournal. Notieren Sie Ihre Bauchgefühle, Annahmen und „Aha!“-Momente, während Sie die Daten analysieren. Allein das Bewusstsein für Ihre eigene Linse ist ein riesiger erster Schritt.
Eine weitere großartige Technik ist die Peer-Debriefing. Holen Sie sich einen Kollegen, der nicht an dem Projekt beteiligt ist, und lassen Sie ihn Ihre Codes und Themen überprüfen. Ein frisches Paar Augen kann Dinge erkennen, die Sie übersehen haben, oder eine Interpretation hinterfragen, die mehr auf Ihrer eigenen Voreingenommenheit als auf den tatsächlichen Daten beruht.
Bei wirklich wichtigen Projekten können Sie mehrere Codierer verwenden, um dieselben Interviews zu analysieren und dann Notizen zu vergleichen. Dieser Prozess, der als Überprüfung der Inter-Coder-Zuverlässigkeit bezeichnet wird, ist eine fantastische Möglichkeit, sicherzustellen, dass Ihre Ergebnisse konsistent und robust sind.
Wenn Sie spezifischere Fragen haben, können Sie jederzeit unsere umfassenden FAQs zu Transkription und Analyse einsehen.
Bereit, das manuelle Ringen mit Transkripten zu beenden und schneller Erkenntnisse zu gewinnen? Transcript.LOL nutzt leistungsstarke KI, um Ihre Interview-Audios in wenigen Minuten in präzisen Text zu verwandeln, komplett mit Zusammenfassungen und Themenvorschlägen, um Ihre Analyse zu starten. Probieren Sie es noch heute kostenlos aus!