How to Analyze Qualitative Research Data: Step-by-Step Guide
Learn how to analyze qualitative research data effectively with our comprehensive, easy-to-follow guide. Improve your research skills today!
Kate, Praveen
December 6, 2023
So you’ve collected your interviews, wrapped up your focus groups, and now you’re sitting on a mountain of raw text. What’s next? This is where the real magic of qualitative research happens: turning all that raw data—transcripts, field notes, and observations—into genuine, credible insights.
The whole point of qualitative analysis is to systematically organize and interpret all this non-numerical information. It's less about finding a single "correct" answer and more about weaving together a compelling, evidence-backed story from what your participants have shared.
Laying the Groundwork for a Meaningful Analysis
Before you can pull out the story hidden in your data, you first need to understand its language. Think of qualitative analysis as an interpretive craft. You’re digging into the context, the motivations, and the narratives that live inside your transcripts. It's a journey of discovery, not just a procedural checklist.
Getting into the right mindset is key. I always tell people to think of themselves as a detective piecing together clues, not a scientist running a sterile experiment. Your first job is to get deeply familiar with the data—the slight hesitations in speech, the phrases that keep popping up, the emotions just under the surface. This kind of immersion is what separates a shallow summary from a truly profound analysis.
This initial stage also demands meticulous data preparation. You can't build a strong case on a shaky foundation, and clean, well-organized transcripts are that foundation. If you're working with interviews, for instance, getting those transcripts right is non-negotiable. Using a reliable service for your interview and focus group transcription can save you a ton of headaches and prevent you from misinterpreting something crucial down the line.
Core Features That Save You Time
State-of-the-art AI
Powered by OpenAI's Whisper for industry-leading accuracy. Support for custom vocabularies, up to 10 hours long files, and ultra fast results.

Import from multiple sources
Import audio and video files from various sources including direct upload, Google Drive, Dropbox, URLs, Zoom, and more.
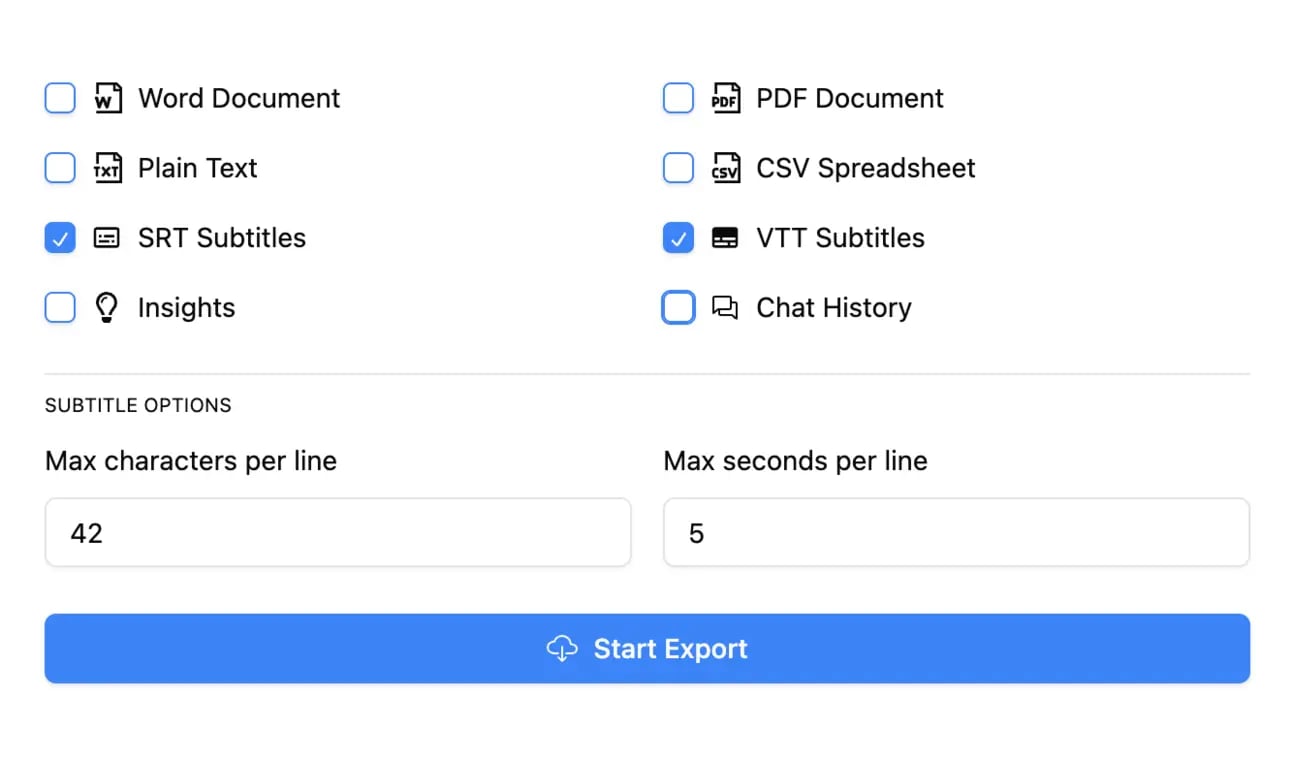
Export in multiple formats
Export your transcripts in multiple formats including TXT, DOCX, PDF, SRT, and VTT with customizable formatting options.
Choosing Your Method
Once your data is prepped and ready, it’s time to decide on your analytical approach. The method you pick will shape how you interact with the data and, ultimately, the kind of insights you’ll be able to generate.
It’s important to remember that qualitative analysis isn't always a straight line. It's often cyclical and iterative, where your early analysis might actually send you back to collect more data.

As this diagram shows, analysis isn’t just the final step. It’s an ongoing conversation with your data that helps you refine your research questions as you go.
There are a lot of ways to slice and dice qualitative data, but most researchers lean on one of five core methods: thematic analysis, content analysis, grounded theory, discourse analysis, or narrative analysis. Each one has a different purpose and is better suited for certain research goals.
Choosing Your Qualitative Analysis Method
This table offers a quick comparison to help you figure out which strategy makes the most sense for your project.
| Method | Primary Goal | Best For |
|---|---|---|
| Thematic Analysis | Identify and report patterns (themes) within the data. | Answering "What are the common ideas here?" Very flexible and great for beginners. |
| Content Analysis | Quantify and count the presence of specific words or concepts. | Answering "How many times was 'support' mentioned negatively?" |
| Grounded Theory | Develop a new theory that is "grounded" in the data itself. | Exploring a new area where little theory exists and building a model from scratch. |
| Discourse Analysis | Analyze how language is used in social contexts. | Understanding how power, identity, and social norms are constructed through speech. |
| Narrative Analysis | Understand how people construct stories and make sense of their lives. | Examining individual experiences through the lens of a complete story (plot, characters, etc.). |
Taking a moment to choose the right method upfront makes the entire process more structured and manageable. It ensures your analysis directly tackles your research objectives.
Key Insights for Researchers
Remember, qualitative analysis is iterative. Your early findings might reshape your research questions.
The goal is not just to summarize but to interpret. Your analysis should answer the "So what?" question, explaining why your findings matter and what they mean in a broader context.
Ultimately, picking the right path from the start helps you turn a complex pile of text into a clear, focused, and insightful story.
Getting Your Data Ready for Analysis

Fantastic analysis doesn't just happen. It starts way before you even think about applying your first code. The real work begins with meticulously preparing your raw materials—your interview transcripts, field notes, and those open-ended survey answers.
Think of it as a chef doing their mise en place. Everything has to be prepped and perfectly organized before the real cooking starts. Getting this stage right is non-negotiable if you want insights you can actually trust.
At the heart of this process is accurate transcription. It feels like an admin task, but your transcript is your primary dataset. A single misheard word or a missing phrase can completely twist a participant's story and send your entire analysis down the wrong path.
Manually transcribing audio is a slow, painful slog—anyone who's done it knows. If you're staring down hours of interviews, do yourself a favor and find a reliable tool to transcribe your audio to text for free. It can save you dozens of hours and give you a much more accurate starting point. But remember, a good transcript is about more than just the words.
It's More Than Just Words on a Page
A basic transcript gives you the "what," but a truly rich one captures the "how." So much of human communication happens in the silent spaces between words. To really get the full picture, your transcripts need to include more than just the dialogue.
I always make sure to add annotations for things like:
- Significant Pauses: A long silence can mean anything from deep reflection to serious discomfort. It's a clue.
- Emotional Tone: Note the laughter, the sighs, or any shifts in vocal energy. I often use simple tags like [voice cracks] or [speaking faster].
- Non-Verbal Cues: If you have video or were in the room, jot down important body language. A shrug, a nod, leaning back—these are all part of the data.
These little details add critical layers of meaning that a simple text file completely misses. A participant saying "I'm fine" means two totally different things if it's followed by a laugh versus a heavy sigh.
My personal rule is this: If it felt important in the moment, it belongs in the transcript. Don't second-guess your intuition during the interview; that gut feeling is often your first analytical spark.
From Chaos to Clarity
Once your transcripts are rich and ready, the next beast to tackle is organization. It’s easy to feel buried when you're looking at potentially hundreds of pages of text. The goal here is to build a system that makes your data feel accessible, not overwhelming.
A simple but incredibly effective strategy is to create a master document or spreadsheet. Think of it as an inventory of all your data sources. I include columns for a participant ID, the date, the data type (interview, field note, etc.), and a quick summary. This alone will keep you from losing track of a crucial file.
The final, and maybe most important, prep step is what I call data immersion. This means reading. And then re-reading. Read everything without the pressure to start analyzing. Just let the stories, the phrases, and the recurring ideas wash over you. It's this deep familiarity that allows patterns to jump out at you when you finally begin to code.
From Raw Text to Actionable Codes
Once you’ve spent time immersing yourself in the data, it's time to start making sense of the chaos. This is where coding comes in—the process of breaking down all that raw text into small, labeled chunks of meaning. Think of it as creating a detailed index for your data; each code is a tag that captures a single idea, concept, or emotion.
Coding is really where the analysis begins. It’s the foundational step that takes you from a dense, intimidating transcript to a structured set of initial ideas. This isn't just about summarizing; it's about systematically deconstructing the text to see its building blocks.
This visual flow shows how you can move from highlighted text to initial codes, and then group those codes into broader categories.
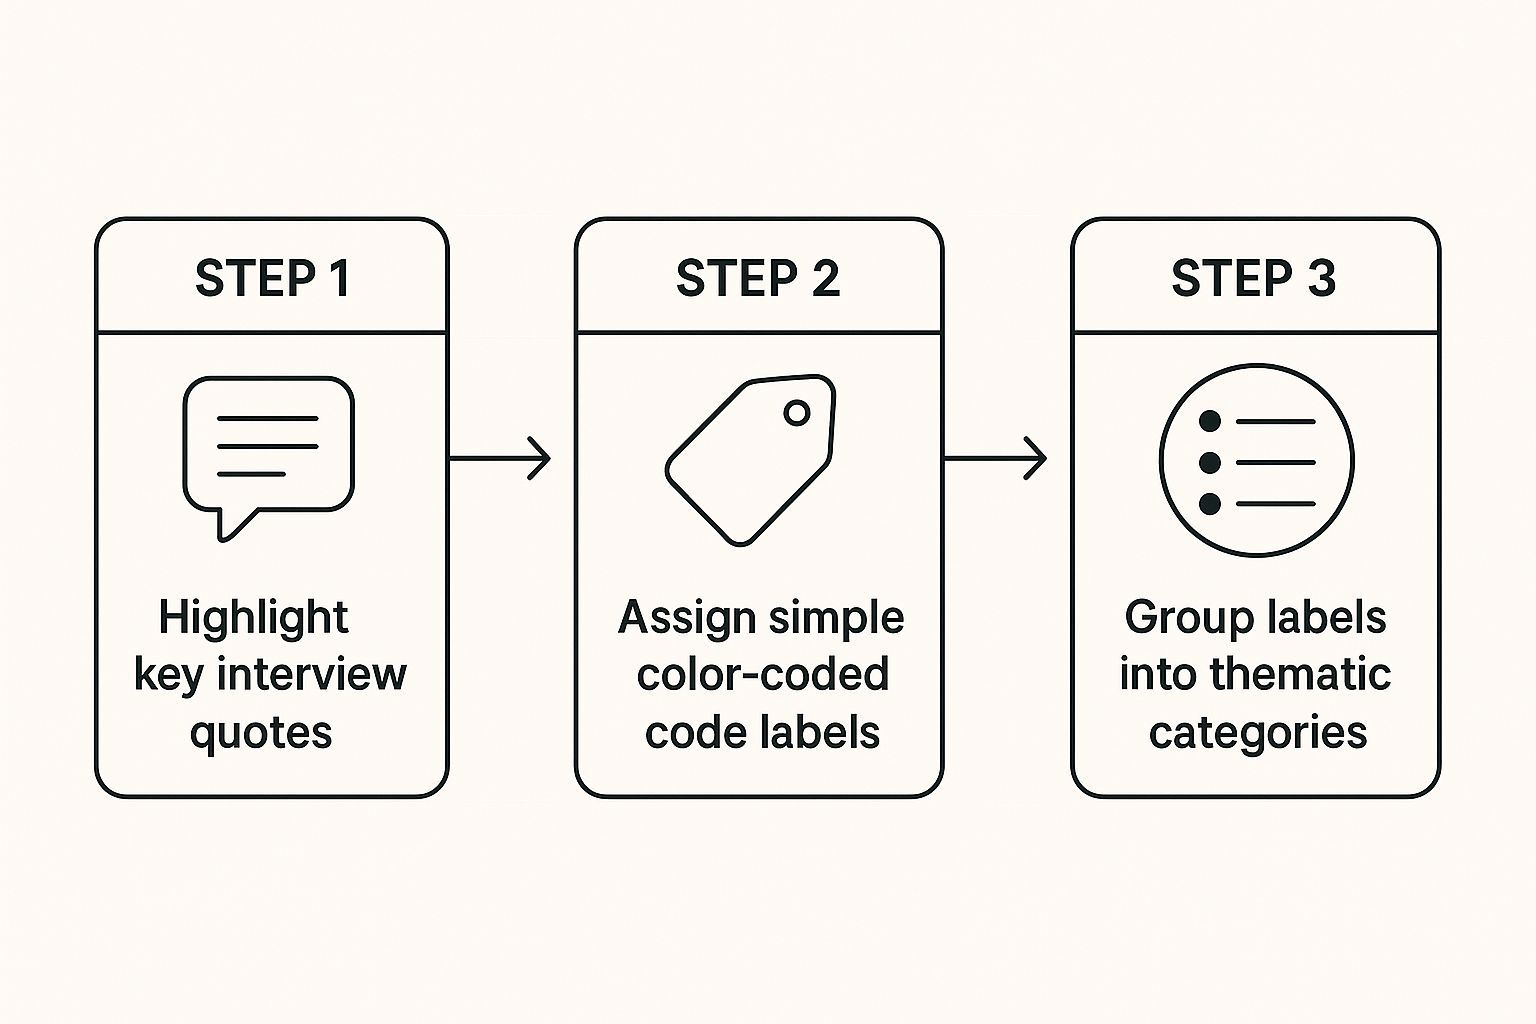
The infographic gets to the heart of coding: spotting significant statements and assigning labels that get them ready for thematic grouping.
Starting With a Clean Slate
One of the most common ways to get started is with open coding, where you begin with no preconceived notions. You just read through the data line by line and create codes based on what jumps out directly from the text. It's an inductive, ground-up process that’s perfect for exploratory research when you don't yet know what patterns you're going to find.
For example, if you're analyzing interview transcripts about workplace satisfaction, you might come up with codes like:
- "Feeling valued by management"
- "Frustration with outdated tools"
- "Positive team collaboration"
The trick is to stay close to the data, using the participants' own words or simple descriptive phrases.
Using a Pre-Built Framework
On the other hand, you could use deductive coding. This approach is really useful when you already have a theory or framework you want to test. You start with a list of pre-determined codes and then look for evidence of them in your data.
Imagine you're analyzing customer feedback using a known customer service model. Your initial codes might include "Responsiveness," "Reliability," and "Empathy." This method is much more structured and efficient for confirming or challenging ideas you already have. For a deeper dive into applying these techniques, our guide on how to analyze interview data provides more specific examples.
No matter which approach you choose, the goal is the same: to create a set of consistent, meaningful labels that you can apply across your entire dataset. This process is rarely linear; you will likely revise, merge, and split codes as your understanding deepens.
Keeping Your Analysis Consistent
As you start developing your codes, it’s absolutely essential to create a codebook. This is a central document that defines each code and provides clear rules for when to apply it. A solid codebook includes:
- Code Name: A short, descriptive label (e.g., "Resource Constraints").
- Full Definition: A detailed explanation of what the code means in the context of your study.
- Inclusion/Exclusion Criteria: Specific rules on what should and should not be assigned this code.
- Example Quote: A clear example from your data that illustrates the code in action.
This document becomes your analytical North Star. It ensures you (and anyone else on your team) apply codes consistently, which makes your findings much more reliable and defensible. It also forces you to think critically about your labels and prevents "coder drift," where the meaning of a code slowly changes over time.
Advanced Tools for Deeper Insights
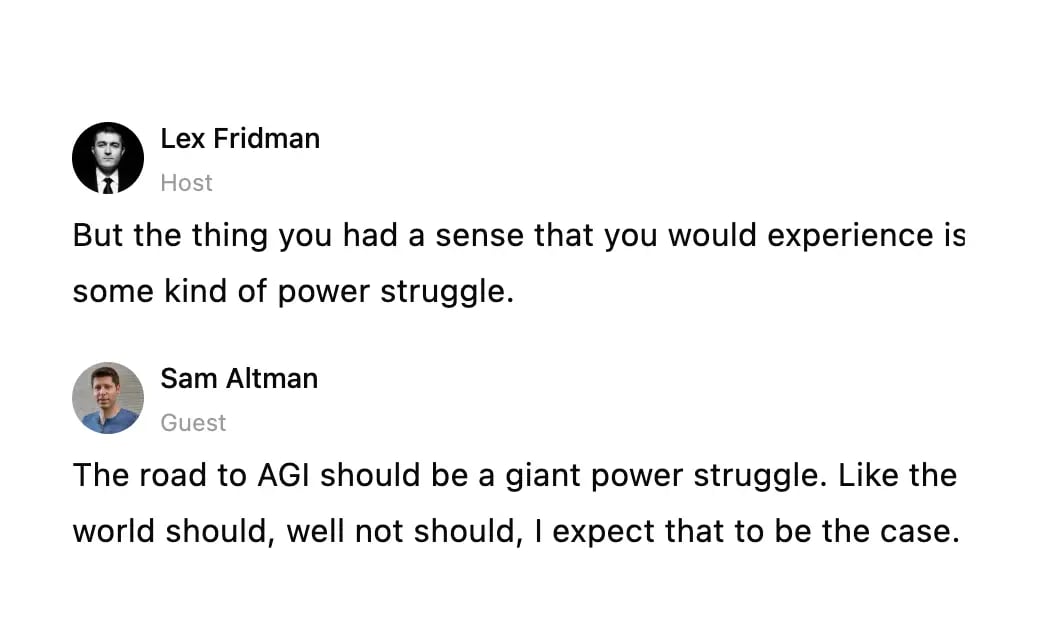
Speaker detection
Automatically identify different speakers in your recordings and label them with their names.
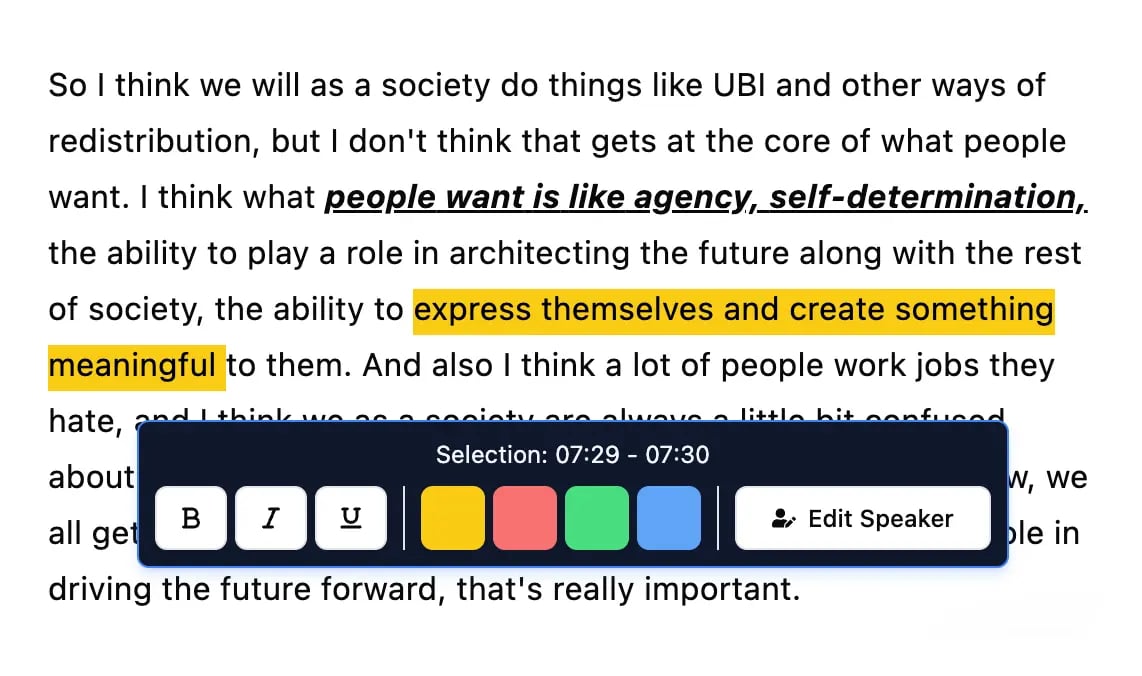
Editing tools
Edit transcripts with powerful tools including find & replace, speaker assignment, rich text formats, and highlighting.
Summaries and Chatbot
Generate summaries & other insights from your transcript, reusable custom prompts and chatbot for your content.
Discovering the Core Themes in Your Data
You've done the hard work of coding your data, essentially creating a detailed index of every idea in your transcripts. Now it's time to zoom out. This is the part where you move from just labeling things to real interpretation, connecting the dots between your codes to find the big, overarching themes.
This isn't about neatly sorting your codes into piles. True thematic analysis is where you uncover the relationships and patterns that tell a compelling story. It’s the moment your raw data starts to reveal powerful, strategic insights.
From Codes to Concepts
The first real step in finding themes is to start grouping your related codes. Lay them all out where you can see them—I'm a fan of using sticky notes on a wall, but a digital whiteboard or a mind map works just as well. Just get them out there and look for codes that feel connected or seem to be pointing at the same underlying idea.
For example, imagine you're analyzing interviews about remote work. You might have codes like "Zoom fatigue," "missing informal chats," and "difficulty collaborating on complex tasks."
Each one is a specific observation. But when you look at them together, they start to form a larger conceptual bucket. You might initially call this group something like "Challenges of Virtual Collaboration."
Honestly, this process is always a bit messy and you’ll circle back on it a few times. You'll move codes around, create new clusters, and rename your groups as you get a better feel for the data. The goal isn't to get it perfect on the first try, but to start seeing how all those individual data points link up to bigger ideas.
Visualizing the Connections
Sometimes, just staring at a list of codes can feel pretty uninspiring. This is where visual techniques can be a total game-changer, especially if you're trying to figure out how to analyze qualitative research data more intuitively.
Two of my favorite methods are affinity diagramming and mind mapping.
- Affinity Diagramming: This is the classic sticky-note method. Write each code on a separate note and physically move them around on a wall or whiteboard. Start grouping them based on your gut feeling without overthinking it. This hands-on approach often reveals connections you’d completely miss in a spreadsheet.
- Mind Mapping: Start with a central research question or a major code in the middle of a page, then branch out with related codes and ideas. This is great for visualizing hierarchical relationships—helping you see which ideas are central and which are just supporting details.
These visual methods help you break out of the linear, text-based mindset and think more spatially and creatively.
Your themes need to do more than just summarize the data; they have to interpret it. A solid theme has a narrative to it. It makes an argument or offers a point of view about your data, answering that all-important "so what?" question.
Pressure-Testing Your Themes
Once you have a set of potential themes, you have to get tough on them. A theme is only as strong as the evidence backing it up. For each one, ask yourself a few critical questions:
- Is it distinct? Does this theme capture a unique idea, or does it overlap too much with another one? If they're too close, you might need to merge them or refine your definitions.
- Is it well-supported? Can you pull several compelling quotes or data excerpts that clearly bring this theme to life? If you're struggling to find good evidence, it’s probably not a real theme.
- Does it answer the research question? Every single theme should directly help you answer your core research objectives. If it doesn’t, it might be an interesting side note, but it’s not a central finding.
By systematically challenging your emerging themes, you make sure your final analysis isn't just a collection of random ideas, but a coherent and defensible story that’s grounded firmly in your data. That's what robust qualitative analysis is all about.
Using Modern Tools to Streamline Your Analysis
The classic image of a qualitative researcher is someone surrounded by highlighters and a wall plastered with sticky notes. While that method still has its place, the right software can be a complete game-changer.
Moving from manual analysis to modern tools isn't just about saving time. It opens up entirely new ways of seeing your data, especially when you're dealing with a large or particularly complex dataset.
Specialized Qualitative Data Analysis Software (or QDAS) essentially acts as a command center for your research. Think of platforms like NVivo or MAXQDA as digital workbenches. They’re built to help you manage hundreds of pages of transcripts, organize thousands of individual codes, and visualize the intricate relationships between them. This is where you graduate from simple sorting to genuine, complex pattern recognition.
Choosing Your Toolkit
You don't always need to bring out the heavy machinery. For smaller projects—say, a dozen interviews or so—a well-organized spreadsheet in Google Sheets or Excel can be surprisingly effective. You can easily set up columns for quotes, codes, and memos to keep your initial analysis clean and straightforward.
But as your dataset grows, the value of dedicated software becomes impossible to ignore.
- QDAS (NVivo, MAXQDA): These tools are designed to handle massive volumes of text, audio, and even video data. Their real power lies in linking codes to themes and then connecting those themes to participant demographics. This lets you ask complex questions like, "How did managers versus junior staff talk about work-life balance?"
- AI-Powered Platforms: A new wave of tools is now incorporating AI to help with tasks like automatic transcription and even suggesting initial codes. They can often spot high-level patterns or sentiment trends that you might miss during a manual first pass.
This screenshot of MAXQDA’s interface shows how a researcher can see a transcript, apply color-coded tags, and view their entire code system all in one window.
The real magic is in the integration. Your data, your codes, and your analytical notes all live in the same place. This creates a clear and defensible audit trail showing exactly how you got from raw data to your final interpretation.
The best tool doesn't replace your critical thinking—it supports it. Software helps manage complexity so you can focus on the uniquely human task of interpretation and meaning-making.
Integrating AI and Quantitative Elements
The role of technology in qualitative analysis is always evolving, and we're seeing more researchers blend what used to be totally separate approaches.
One of the most interesting developments is using statistical tools to manage and interpret findings. Even though the research is non-numerical at its core, bringing in methods like descriptive statistics can help you spot patterns in qualitative data that have quantitative elements. For instance, you could count the frequency of certain codes across different participant groups.
And while our focus here is on qualitative methods, looking at adjacent fields like higher education data analytics can offer fresh ideas on how to handle large datasets with modern tools.
Ultimately, whether you're using a simple spreadsheet or advanced AI software, everything starts with an accurate transcript. That’s the foundation. To get that right, check out our review of the best meeting transcription software to find a tool that fits your workflow.
👥 Who Benefits Most From Modern Transcription Tools?
📚 Researchers
Quickly organize large interview sets into meaningful insights.
📰 Journalists
Pull quotes and verify facts in minutes, not hours.
🏢 Teams & Businesses
Share transcripts across departments for better collaboration.
🎙️ Creators
Repurpose interviews into podcasts, blogs, or social content.
Common Questions About Qualitative Analysis
Diving into qualitative analysis always brings up a few tricky questions, even for those of us who have been doing this for years. It's totally normal to wrestle with things like bias, sample size, and which method is really the right one. Let's tackle some of the most common ones head-on.
One of the biggest hurdles is our own subjectivity. As the researcher, you are the analytical tool, which means your own perspective inevitably colors how you see the data. Trying to be a completely neutral observer is a losing battle. The real goal isn't some false sense of objectivity—it's transparency.
I make it a habit to keep a "researcher's journal" for every single project. In it, I'll jot down my initial assumptions before I even start, my gut reactions during an interview, or ideas that pop into my head along the way. This simple practice helps me see my own biases so I can consciously set them aside and focus on what the data is actually saying. It’s all about self-awareness.

Determining the Right Sample Size
Another question I hear all the time is, "So, how many interviews do I actually need?" Unlike quant research, there's no magic number here. The answer is a concept called saturation.
You've hit saturation when you keep collecting data but stop hearing anything new. The stories start to sound familiar, the same themes pop up again and again, and you feel like your analytical categories are solid. For a tightly focused study, this might happen after just 12-15 interviews. For a more sprawling, complex topic, you might need more.
Don't get hung up on a target number before you start. It’s all about the richness of the data. One truly insightful, deep interview can be worth more than three surface-level ones. The quality of your participants and your skill as an interviewer matter way more than the final count.
Combining Different Analytical Methods
Finally, people often wonder if it's okay to mix and match analytical methods. The answer is a big yes, as long as you have a good reason for it. This approach, known as methodological triangulation, can seriously strengthen your findings.
For example, you could use thematic analysis to get a bird's-eye view of the patterns across all your interviews, then zoom in on a few specific transcripts with narrative analysis to really dig into individual stories.
Here’s how you could approach it:
- Start Broad: Kick things off with a method like thematic analysis to map out the general landscape of your entire dataset.
- Go Deep: Next, pick a few of the most compelling interviews and apply a more focused method, like discourse analysis, to examine the subtle details of language.
- Integrate Findings: The final step is to explain how the insights from each method support or even challenge each other, which gives you a much more robust and layered interpretation.
Combining methods isn't about just trying everything to see what works. It's a strategic move that lets you look at your data from multiple angles, leading to far more credible and insightful conclusions.
⚠️ Don’t Risk Losing Key Insights
Manual transcription wastes hours and risks errors that weaken your research. Secure, AI-powered transcripts give you a rock-solid foundation. 👉 Try it now at Transcript.LOL
Ready to turn your interviews and focus groups into clear, actionable text? Transcript.LOL provides lightning-fast, highly accurate transcriptions so you can focus on analysis, not administration. Start transcribing for free and streamline your research workflow today.